Who Gets the Money on Meta? 1% of Ads Take 61% of the Spend
Across 59 DTC brands and 350,247 Meta ads in the 12 months to 1 November 2026, the top 1% of ads at each brand took 61% of the spend. The next 9% took 32% and the other 90% took 7%. At the median brand the top 1% took 47%, and at every brand it took at least a quarter. The top 1% ran for a median of 102 days. The other 90% ran for 8, and 48% of them were done within a week.
I made this as a carousel for LinkedIn and Instagram. This page has the full numbers and how we got them. To see your own account split the same way, drop an Ads Manager export into the Meta ads winner checker.
We took every Meta ad that the 59 brands we work with ran in the 12 months to 1 November 2026, ranked each brand's ads by what they spent, and split them into the top 1%, the next 9% and the other 90%. The data covers the whole ad account, so it includes ads the brands made themselves or got from other agencies, as well as ours. Facebook and Instagram only. Every brand is anonymous, and every figure in the text and tables covers 8 or more brands. The method is at the bottom of the page.
How Meta splits the spend
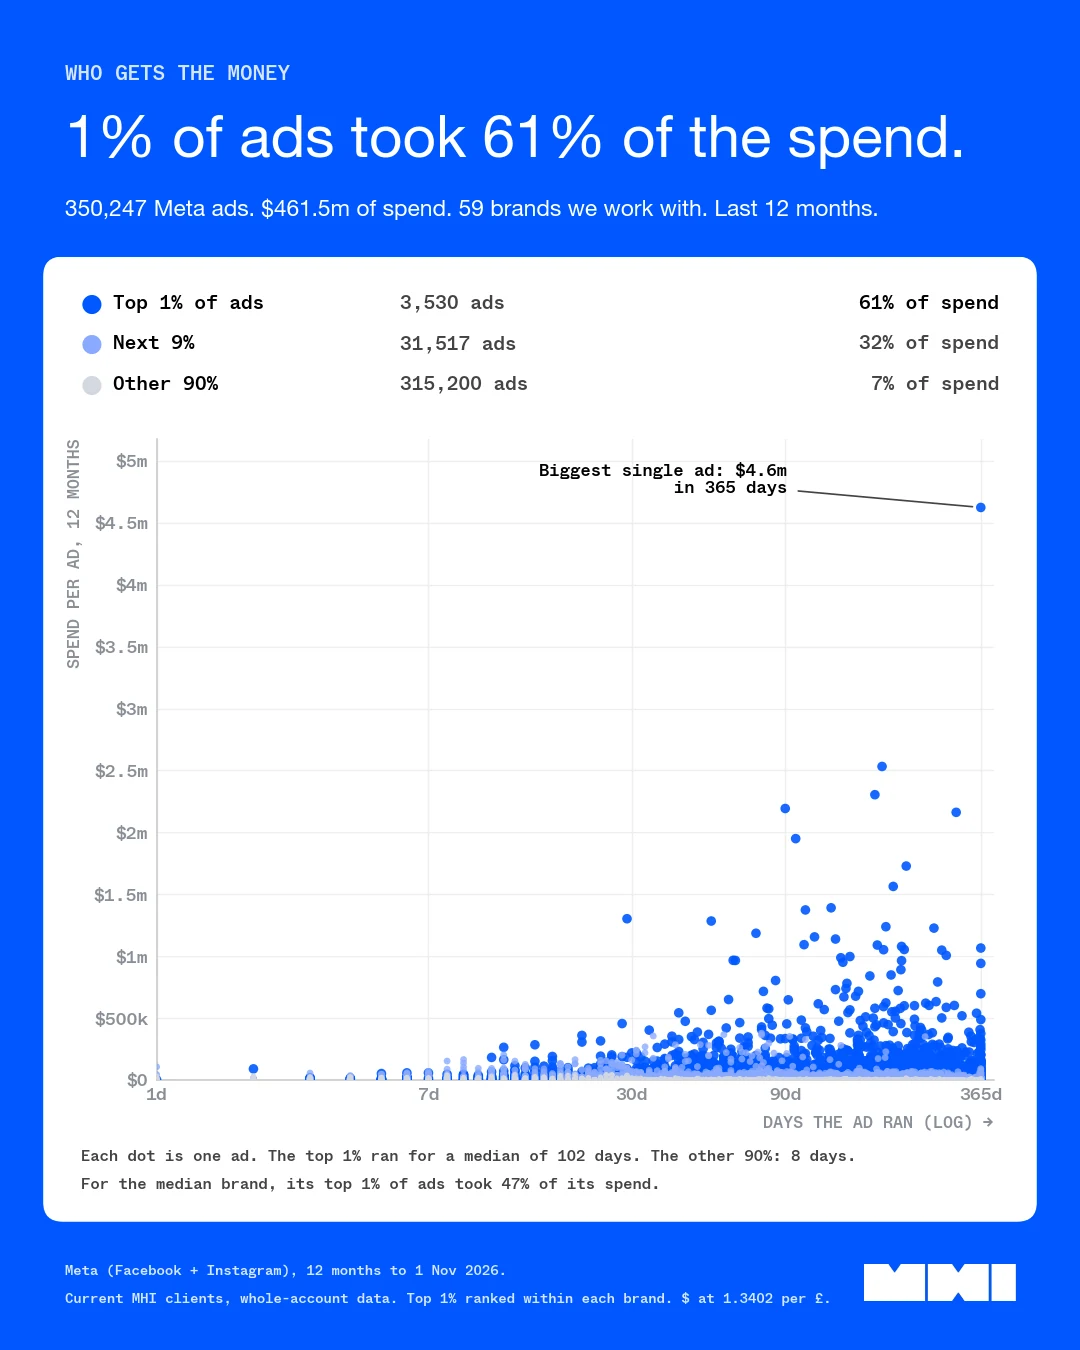
Each brand's ads are ranked by that brand's own spend, so the top 1% at a brand with 2,000 ads is its 20 biggest ads. The bands are then added up across all 59 brands.
| Band | Ads | Share of spend | Median days run | Ran 7 days or fewer | Ran 30 days or more |
|---|---|---|---|---|---|
| Top 1% | 3,530 | 61.2% | 102 | 1.1% | 88.2% |
| Next 9% | 31,517 | 32.1% | 32 | 11.0% | 52.6% |
| Other 90% | 315,200 | 6.7% | 8 | 47.6% | 22.0% |
Source: MHI Media warehouse of client Meta ad accounts, read 4 November 2026. Days run = first to last day with spend.
So 3,530 ads took 61% of the money, and 315,200 ads shared 7%. 72% of all the ads spent under $100 in the whole year.
The winners ran for much longer too. The median top 1% ad ran for 102 days, and 67% of them ran for 60 days or more. The median ad in the other 90% ran for 8 days.
Does every brand look like this?
Yes. The pooled figure leans on the biggest accounts, so we worked it out brand by brand as well.
- At the median brand, the top 1% of ads took 47% of the spend. The middle half of brands sat between 40% and 61%.
- At every one of the 59 brands, the top 1% took at least a quarter of the spend.
- At all 59 brands, the top 1% ran for longer than the other 90%. At the median brand that was 102 days against 10.
Bigger accounts put more of their spend on their top 1%, which is why the pooled 61% is higher than the median brand's 47%. The pattern itself shows up at every size of account.
How long do winning Meta ads run?
The more an ad spent, the longer it had run. None of the 480 ads that spent $150,000 or more got there in 7 days or fewer, and 94.6% of them ran for 30 days or more.
| Spent in 12 months | Ads | Brands | Ran 7 days or fewer | Ran 30 days or more | Median days run |
|---|---|---|---|---|---|
| $50,000+ | 1,636 | 42 | 11 | 90.7% | 118 |
| $100,000+ | 764 | 41 | 1 | 92.4% | 136 |
| $150,000+ | 480 | 30 | 0 | 94.6% | 140 |
| $500,000+ | 75 | 10 | 0 | 98.7% | 171 |
Source: MHI Media warehouse of client Meta ad accounts, read 4 November 2026.
Part of that is arithmetic, because reaching $150,000 inside a week takes more than $21,000 a day. The pattern holds lower down too: 11 of the 1,636 ads that spent $50,000 or more got there inside a week.
If an ad is still spending at day 30, have you found a winner?
Usually not. We took the 245,075 ads that launched between 2 December 2025 and 2 October 2026, so every one had at least 30 days to show what it did, and split them by whether they were still spending 30 days after launch.
| Group | Ads | Ended in its brand's top 1% | Ended in its brand's top 10% |
|---|---|---|---|
| Still spending at day 30 | 80,672 | 3.1% | 20.9% |
| Stopped before day 30 | 164,403 | 0.1% | 5.9% |
Source: MHI Media warehouse of client Meta ad accounts, read 4 November 2026.
An ad still spending at day 30 was 3.5 times as likely to end up in its brand's top 10%. Four in five of them still didn't make it. An ad that had stopped before day 30 almost never became a top 1% ad: 0.1% did. Day 30 gives you a shortlist. Keep those ads running and let the spend sort them.
Winners by category
Brands are grouped by what they sell, and four categories have 8 or more brands. Figures are medians across the brands in each category, except the pooled column, which adds every ad in the category together.
| Category | Brands | Top 1% share of spend, median brand | Top 1% share, all ads pooled | Top 1% median days run | Other 90% median days run | Other 90% that ran 7 days or fewer |
|---|---|---|---|---|---|---|
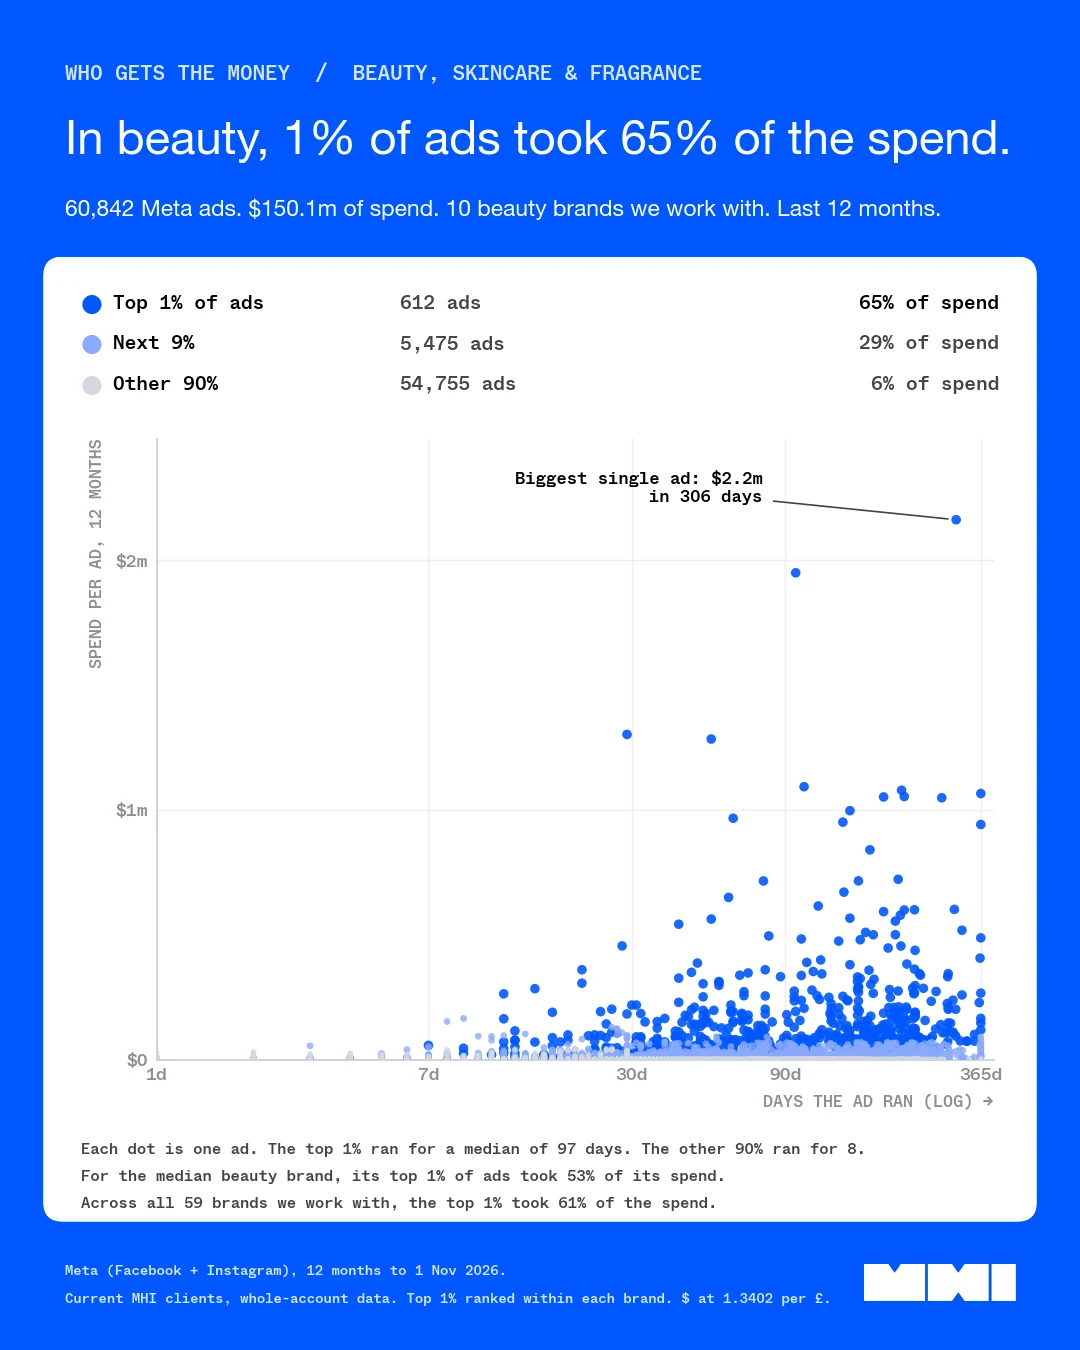
| Beauty, skincare and fragrance | 10 | 53% | 65% | 54 | 7 | 54% |
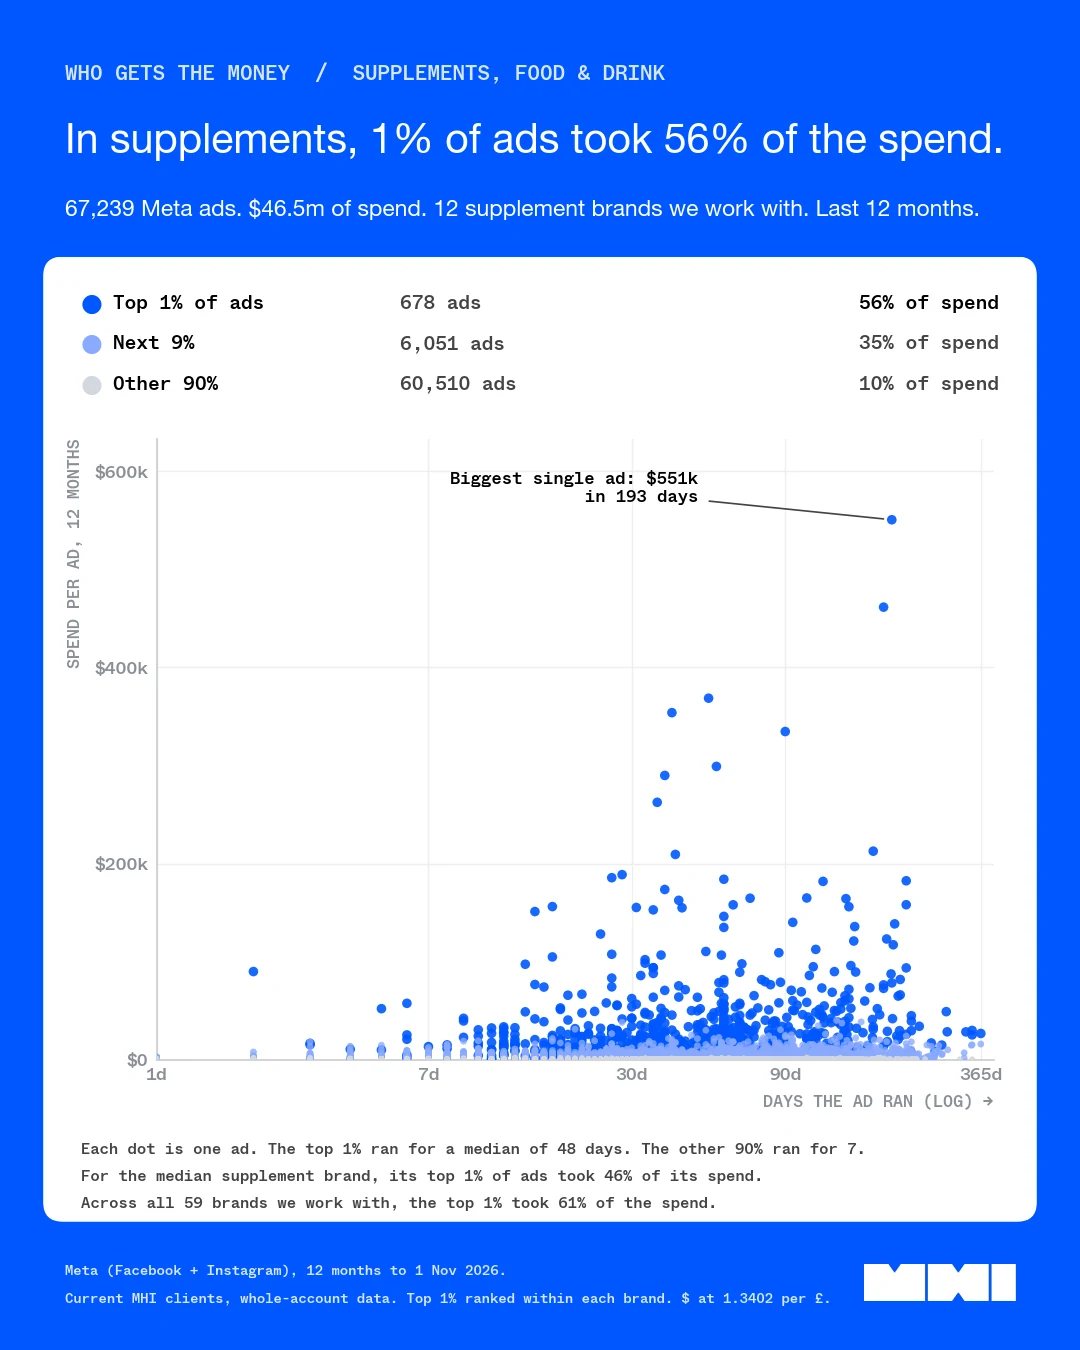
| Supplements, food and drink | 12 | 46% | 56% | 55 | 7 | 55% |
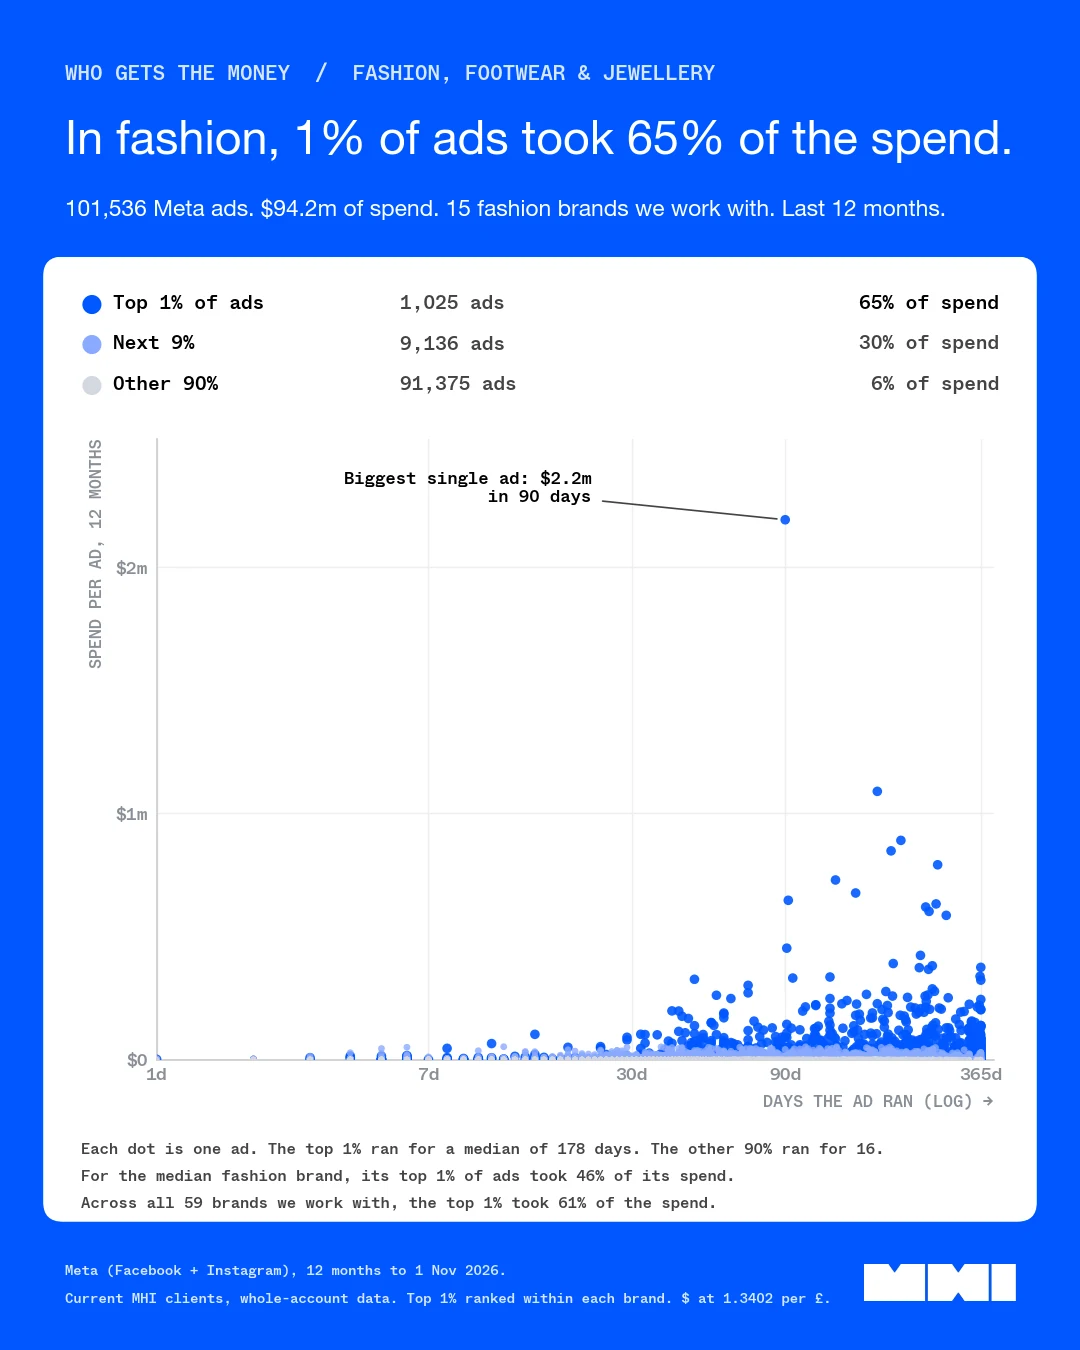
| Fashion, footwear and jewellery | 15 | 46% | 65% | 130 | 25 | 22% |
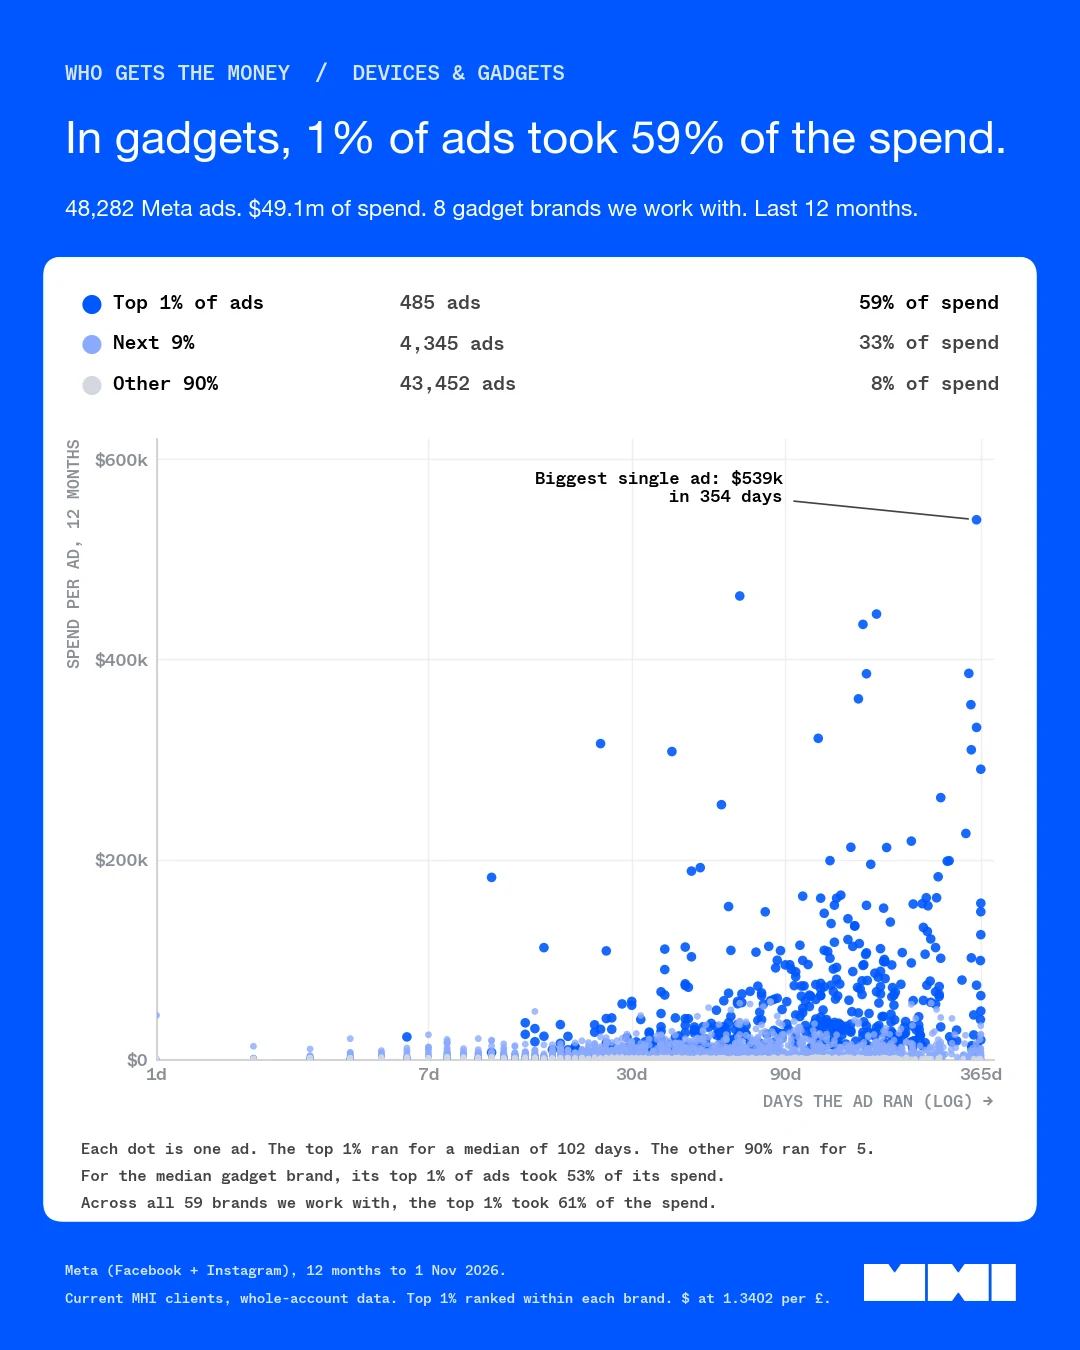
| Devices and gadgets | 8 | 53% | 59% | 167 | 11 | 48% |
| All 59 brands | 59 | 47% | 61% | 102 | 10 | 45% |
Source: MHI Media warehouse of client Meta ad accounts, read 4 November 2026.
Beauty and supplements stand out. The median brand's top 1% ran for 54 days in beauty and 55 in supplements, about half the 102 across all brands, so those accounts need their next winner ready sooner. Gadget and fashion winners ran the longest, at 167 and 130 days for the median brand.
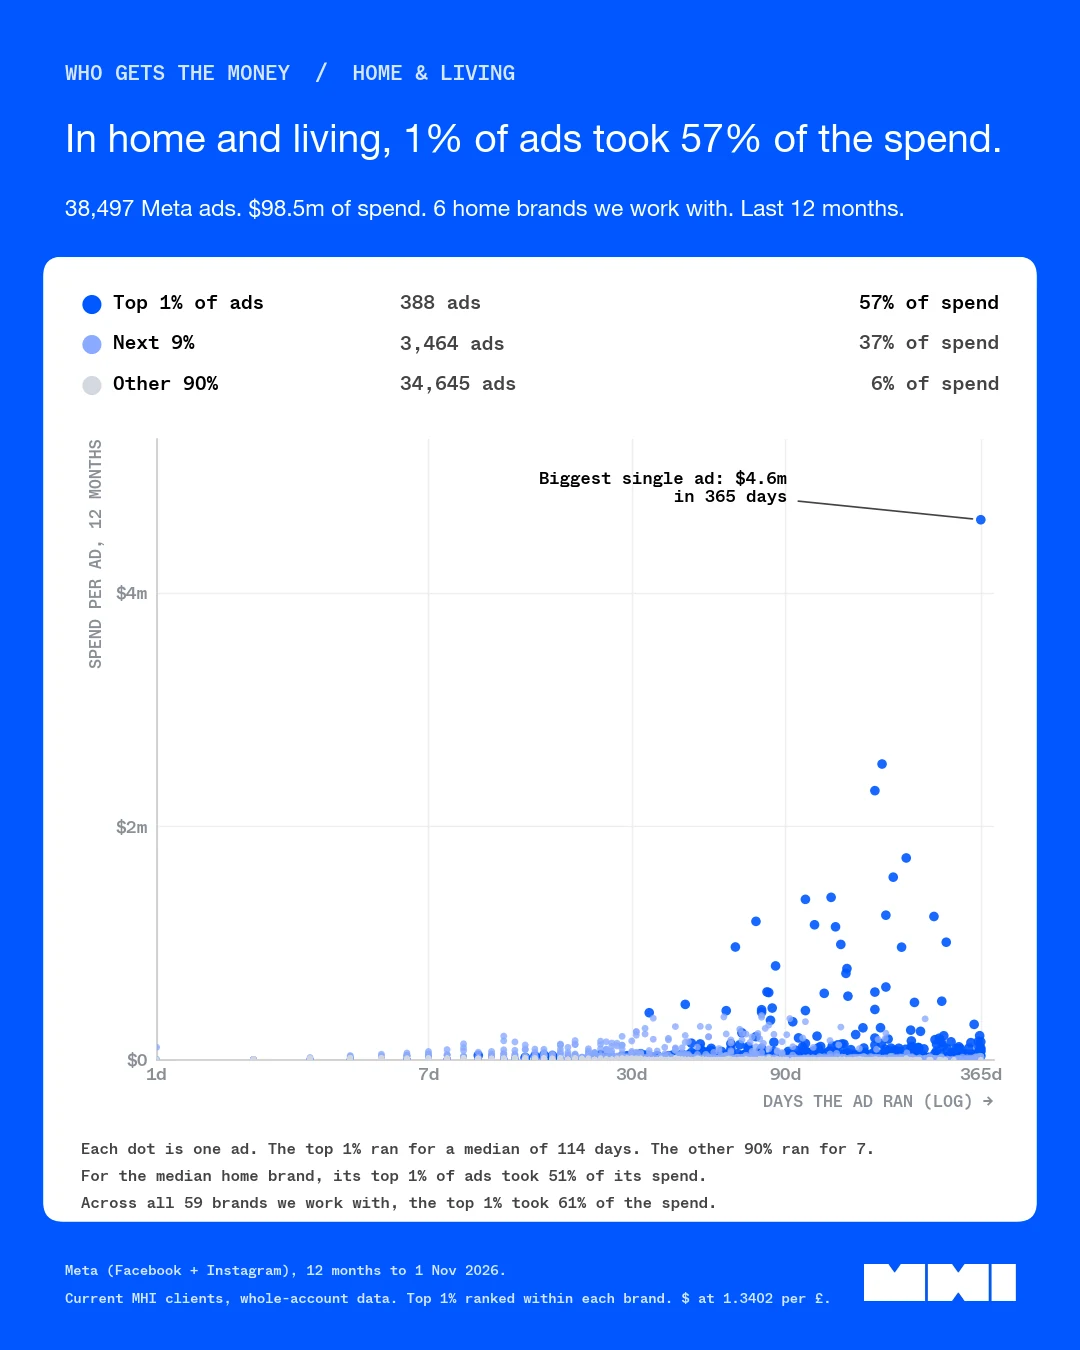
The pooled column is higher than the median brand in every category for the same reason as above: the bigger accounts are more top heavy. Home and living has 6 brands, so it has a card below but stays out of the table, which needs 8. The smaller categories (6 brands) and 2 brands we couldn't place are only in the all-brands figures.
What I'd do with it
These are my working rules from the numbers above.
- Give Meta enough new ads to choose from. At every brand the budget ends up on a small group of ads, and nobody can tell in advance which ones, so creative testing is a numbers game. Our creative volume benchmarks have the launch numbers: the median brand launched 353 new ads a month over July to September 2026.
- Judge a new ad on whether Meta keeps spending on it. Meta decides where the budget goes, so spend is the clearest read on which ads it rates. An ad still spending at day 30 goes on the shortlist.
- Leave winners alone. The top 1% ran for a median of 102 days. If an ad is still taking spend, keep it running, even if you're sick of seeing it.
- Don't stress about the flops. The other 90% took 7% of the spend between them, and 72% of all ads spent under $100 in the year. A flop costs very little in media. Its real cost is the time it took to make.
- In beauty and supplements, plan for winners to wear out sooner. At 54 and 55 days for the median brand, the next winner has to be ready in about half the time.
If an ad has stopped and you want to know why, start with why Meta ads stop spending.
How we worked it out
The data is ad-level daily spend from the Meta ad accounts of the 59 brands we work with that had spend in the 12 months from 2 November 2025 to 1 November 2026, read from MHI Media's warehouse on 4 November 2026. Each brand counts once, with all its ad accounts added together. An ad is one ad name within a brand, so the same ad name in two ad sets counts once. The data covers the whole account, so it includes ads made by the brands themselves and by other agencies.
Each brand's ads are ranked by their 12-month spend. The top 1% is the highest-spending 1% at that brand, the next 9% are the ones after that, and the other 90% is everything else. Days run is the first to the last day with spend inside the 12 months, so it includes any days an ad was paused. Ads launched near the end of the window had less time to run, and ads already live at the start had their earlier days cut off. The day 30 table uses only ads launched between 2 December 2025 and 2 October 2026 to avoid both problems.
Spend is in US dollars at £1 = $1.3402, with euro, Canadian dollar and Australian dollar accounts converted at the same rate set the Meta ads benchmarks use. Shares of spend within a brand barely move with the exchange rate. Brands are grouped by what they sell, checked brand by brand in November 2026. Every figure in the text and tables covers 8 or more brands, and the home and living card covers 6. The cards are drawn from the same read and also mark the biggest single ad in each group. No brand is named.
FAQ
What percentage of Meta ads get most of the spend?
Across 59 DTC brands and 350,247 Meta ads in the 12 months to 1 November 2026, the top 1% of ads at each brand took 61% of the spend, the next 9% took 32% and the other 90% took 7%. At the median brand the top 1% took 47%.
How long do winning Facebook ads run?
The top 1% of ads at 59 DTC brands ran for a median of 102 days, and 67% of them ran for 60 days or more. Of the 480 ads that spent $150,000 or more in 12 months, none got there in a week and 94.6% ran for 30 days or more.
Is it normal for most of my Meta ads to get almost no spend?
Yes. 72% of the 350,247 ads in this data spent under $100 in the whole year, and the bottom 90% of ads at each brand took 7% of the spend between them. 48% of those ads were done within a week.
How long should I leave a new Meta ad running?
Our data can't set a switch-off date, but it shows the pattern. Ads still spending 30 days after launch were 3.5 times as likely to end up in their brand's top 10% as ads that had stopped, and only 1.1% of top 1% ads ran for 7 days or fewer. I'd keep anything Meta is still spending on and let the spend decide.
Is Meta ad spend this concentrated in every category?
Yes. In beauty, supplements, fashion and gadgets the median brand's top 1% of ads took between 46% and 53% of the spend. Beauty and supplement winners ran the shortest, at 54 and 55 days for the median brand, and gadget and fashion winners the longest, at 167 and 130 days.
Sources
- MHI Media warehouse of client Meta ad accounts, read 4 November 2026, 12 months to 1 November 2026
- MHI Meta Benchmarks, DTC, MHI Media, hub post with methodology
- Meta ads creative volume benchmarks, MHI Media, new ads launched per month